
ไฟล์:2017 North Indian Ocean cyclone season summary.png

ขนาดของตัวอย่างนี้: 800 × 494 พิกเซล ความละเอียดอื่น: 320 × 198 พิกเซล | 640 × 396 พิกเซล | 1,024 × 633 พิกเซล | 1,280 × 791 พิกเซล | 2,560 × 1,582 พิกเซล | 4,000 × 2,472 พิกเซล
ดูภาพที่มีความละเอียดสูงกว่า (4,000 × 2,472 พิกเซล, ขนาดไฟล์: 10.07 เมกะไบต์, ชนิดไมม์: image/png)
| รูปภาพหรือไฟล์เสียงนี้ ต้นฉบับอยู่ที่ คอมมอนส์ รายละเอียดด้านล่าง เป็นข้อความที่แสดงผลจาก ไฟล์ต้นฉบับในคอมมอนส์
|
ความย่อ
| คำอธิบาย |
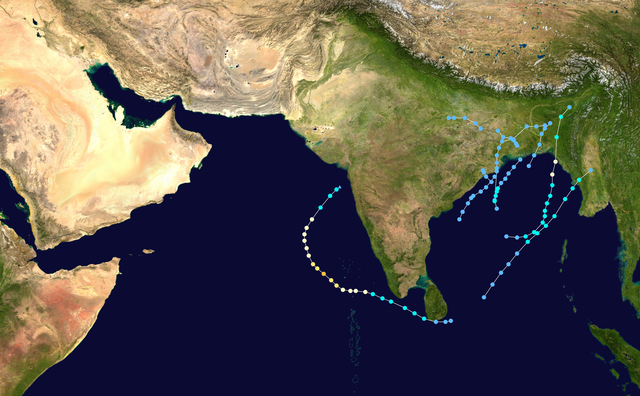
English: This map shows the tracks of all tropical cyclones in the 2017 North Indian Ocean cyclone season. The points show the location of each storm at 6-hour intervals. The colour represents the storm's maximum sustained wind speeds as classified in the Saffir-Simpson Hurricane Scale (see below), and the shape of the data points represent the type of the storm. Map generation parameters: --res 4000 --extra 1 --dots 0.2 --lines 0.04 --xmin 40 --xmax 100 --ymin 0 --ymax 35
Tropical depression (≤38 mph, ≤62 km/h)
Tropical storm (39–73 mph, 63–118 km/h)
Category 1 (74–95 mph, 119–153 km/h)
Category 2 (96–110 mph, 154–177 km/h)
Category 3 (111–129 mph, 178–208 km/h)
Category 4 (130–156 mph, 209–251 km/h)
Category 5 (≥157 mph, ≥252 km/h)
Unknown
Storm type |
| แหล่งที่มา | Created using Wikipedia:WikiProject Tropical cyclones/Tracks. The background image is from NASA [1]. The tracking data is from the Joint Typhoon Warning Center's best track database |
| ผู้สร้างสรรค์ | Meow |

|
This file may be updated to reflect new information. If you wish to use a specific version of the file without new updates being mirrored, please upload the required version as a separate file. |
| งานนี้ได้ถูกเผยแพร่สู่สาธารณสมบัติโดยเจ้าของ Meow ซึ่งมีผลทั่วโลก ในบางประเทศ การกระทำดังกล่าวอาจไม่สามารถทำได้ตามกฎหมาย Meow อนุญาตให้ทุกคนมีสิทธิ์ในการใช้ไฟล์นี้ในทุกเหตุผลการใช้ โดยไม่มีมีเงื่อนไข เว้นแต่กฎหมายไม่อนุญาตให้ทำเช่นนั้น |
ประวัติไฟล์
คลิกวันที่/เวลาเพื่อดูไฟล์ที่ปรากฏในขณะนั้น
| วันที่/เวลา | รูปย่อ | ขนาด | ผู้ใช้ | ความเห็น | |
|---|---|---|---|---|---|
| ปัจจุบัน | 14:10, 26 พฤศจิกายน 2562 | | 4,000 × 2,472 (10.07 เมกะไบต์) | Supportstorm | Best track update |
| 01:46, 27 กุมภาพันธ์ 2561 |  | 4,000 × 2,472 (9.26 เมกะไบต์) | Keith Edkins | Ockhi & BOB 08 | |
| 04:26, 19 พฤศจิกายน 2560 |  | 4,000 × 2,472 (9.22 เมกะไบต์) | Keith Edkins | Up to BOB06 | |
| 04:22, 28 กรกฎาคม 2560 |  | 4,000 × 2,472 (9.19 เมกะไบต์) | Keith Edkins | Add 3 depressions | |
| 19:07, 31 พฤษภาคม 2560 |  | 4,000 × 2,472 (9.86 เมกะไบต์) | Meow | Mora | |
| 22:10, 29 พฤษภาคม 2560 |  | 4,000 × 2,472 (9.85 เมกะไบต์) | Meow | == {{int:filedesc}} == {{Hurricane season auto track map|start=2017-04-13|end=|source=JTWC|type=cyclone|basin=North Indian Ocean|year=2017|comments= Map generation parameters: <tt>--res 4000 --extra 1 --dots 0.2 --lines 0.04 --xmin 40 --xmax 100 -... |
หน้าที่มีภาพนี้
หน้าต่อไปนี้ โยงมาที่ภาพนี้:
การใช้ไฟล์ข้ามโครงการ
วิกิอื่นต่อไปนี้ใช้ไฟล์นี้:
- การใช้บน bn.wikipedia.org
- การใช้บน de.wikipedia.org
- การใช้บน en.wikipedia.org
- การใช้บน es.wikipedia.org
- การใช้บน ko.wikipedia.org
- การใช้บน pt.wikipedia.org
- การใช้บน zh.wikipedia.org