ไฟล์:1000 Year Temperature Comparison.png

ไม่รองรับเนื้อหาของหน้าในภาษาอื่น
จากวิกิพีเดีย สารานุกรมเสรี

1000_Year_Temperature_Comparison.png(599 × 442 พิกเซล, ขนาดไฟล์: 32 กิโลไบต์, ชนิดไมม์: image/png)

Wikimedia Commons logo รูปภาพหรือไฟล์เสียงนี้ ต้นฉบับอยู่ที่ คอมมอนส์ รายละเอียดด้านล่าง เป็นข้อความที่แสดงผลจาก ไฟล์ต้นฉบับในคอมมอนส์
คอมมอนส์เป็นเว็บไซต์ในโครงการสำหรับเก็บรวบรวมสื่อเสรี ที่ คุณสามารถช่วยได้
ภาพกราฟนี้ ควรจะถูกสร้างใหม่เป็นกราฟิกส์เวกเตอร์ ซึ่งมีข้อดีอีกหลายประการ ดูเพิ่มเติมที่คอมมอนส์:สื่อต้องการเก็บกวาดสำหรับสารสนเทศเพิ่มเติม หากภาพนี้มีในรูปแบบกราฟิกส์เวกเตอร์อยู่แล้ว กรุณาอัปโหลดและแทนที่แม่แบบนี้ด้วย {{vector version available|ชื่อภาพใหม่}}
แนะนำเป็นอย่างยิ่งให้ตั้งชื่อไฟล์เวกเตอร์ใหม่นั้นในรูปแบบ "1000 Year Temperature Comparison.svg" แล้วใส่แม่แบบ Vector version available (หรือ Vva) ซึ่งไม่ต้องใช้พารามิเตอร์ ชื่อภาพใหม่

ความย่อ

คำอธิบาย
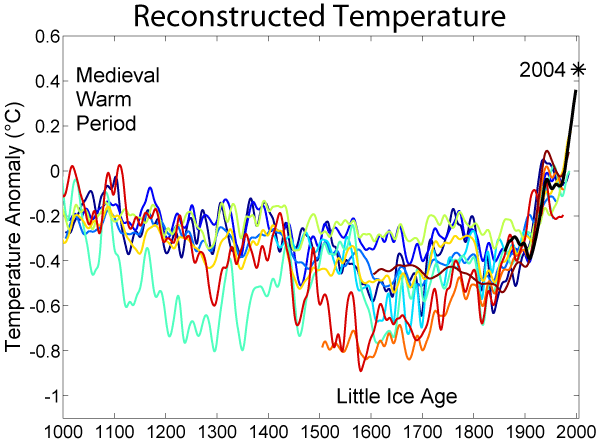
English: This image is a comparison of 10 different published reconstructions of mean temperature changes during the 2nd millennium. More recent reconstructions are plotted towards the front and in redder colors, older reconstructions appear towards the back and in bluer colors. An instrumental history of temperature is also shown in black. The medieval warm period and little ice age are labeled at roughly the times when they are historically believed to occur, though it is still disputed whether these were truly global or only regional events. The single, unsmoothed annual value for 2004 is also shown for comparison. (Image:Instrumental Temperature Record.png shows how 2004 relates to other recent years).

It is unknown which, if any, of these reconstructions is an accurate representation of climate history; however, these curves are a fair representation of the range of results appearing in the published scientific literature. Hence, it is likely that such reconstructions, accurate or not, will play a significant role in the ongoing discussions of global climate change and global warming.

For each reconstruction, the raw data has been decadally smoothed with a σ = 5 yr Gaussian weighted moving average. Also, each reconstruction was adjusted so that its mean matched the mean of the instrumental record during the period of overlap. The variance (i.e. the scale of fluctuations) was not adjusted (except in one case noted below).

Except as noted below, all original data for this comparison comes from here and links therein. It should also be noted that many reconstructions of past climate report substantial error bars, which are not represented on this figure.
วันที่
แหล่งที่มา http://www.globalwarmingart.com/wiki/File:1000_Year_Temperature_Comparison.png
ผู้สร้างสรรค์ Robert A. Rohde
เวอร์ชันอื่น

Reconstructions

The reconstructions used, in order from oldest to most recent publication are:

  1. (dark blue 1000-1991): The Holocene.
  2. (blue 1000-1980): Geophysical Research Letters.
  3. (light blue 1000-1965): Ambio. Modified as published in Science.
  4. (lightest blue 1402-1960): J. Geophys. Res..
  5. (light green 831-1992): Science.
  6. (yellow 200-1980): Geophysical Research Letters. doi:10.1029/2003GL017814.
  7. (orange 200-1995): Reviews of Geophysics. doi:10.1029/2003RG000143
  8. (red-orange 1500-1980): Geophys. Res Lett.. doi:10.1029/2004GL019781
  9. (red 1-1979): Nature. doi:10.1038/nature03265
  10. (dark red 1600-1990): Science. doi:10.1126/science.1107046

(black 1856-2004): Instrumental data was jointly compiled by the Climatic Research Unit and the UK Meteorological Office Hadley Centre. Global Annual Average data set TaveGL2v [1] was used.

Documentation for the most recent update of the CRU/Hadley instrumental data set appears in: Journal of Climate.

การอนุญาตใช้สิทธิ

The original version of this figure was prepared by Robert A. Rohde from publicly available data and is incorporated into the Global Warming Art project.

Image from Global Warming Art
This image is an original work created for Global Warming Art. Please refer to the Year Temperature Comparison.png image description page for more information.
GNU head อนุญาตให้คัดลอก แจกจ่ายและ/หรือดัดแปรเอกสารนี้ภายใต้เงื่อนไขของสัญญาอนุญาตเอกสารเสรีของกนู รุ่น 1.2 หรือรุ่นใด ๆ นับจากนี้ที่ออกโดยมูลนิธิซอฟต์แวร์เสรี โดยไม่มีส่วนใดห้ามแก้ไข ไม่มีข้อความปกหน้าและปกหลัง สำเนาของสัญญาอนุญาตรวมอยู่ในส่วนชื่อ สัญญาอนุญาตเอกสารเสรีของกนู
w:th:ครีเอทีฟคอมมอนส์
แสดงที่มา อนุญาตแบบเดียวกัน
ไฟล์นี้อยู่ภายใต้สัญญาอนุญาต ครีเอทีฟคอมมอนส์ แบบแสดงที่มา-อนุญาตแบบเดียวกัน 3.0 ต้นฉบับ
คุณสามารถ:
  • ที่จะแบ่งปัน – ที่จะทำสำเนา แจกจ่าย และส่งงานดังกล่าวต่อไป
  • ที่จะเรียบเรียงใหม่ – ที่จะดัดแปลงงานดังกล่าว
ภายใต้เงื่อนไขต่อไปนี้:
  • แสดงที่มา – คุณต้องให้เกียรติเจ้าของงานอย่างเหมาะสม โดยเพิ่มลิงก์ไปยังสัญญาอนุญาต และระบุหากมีการเปลี่ยนแปลง คุณอาจทำเช่นนี้ได้ในรูปแบบใดก็ได้ตามควร แต่ต้องไม่ใช่ในลักษณะที่แนะว่าผู้ให้อนุญาตสนับสนุนคุณหรือการใช้งานของคุณ
  • อนุญาตแบบเดียวกัน – หากคุณดัดแปลง เปลี่ยนรูป หรือต่อเติมงานนี้ คุณต้องใช้สัญญาอนุญาตแบบเดียวกันหรือแบบที่เหมือนกับสัญญาอนุญาตที่ใช้กับงานนี้เท่านั้น
ป้ายแสดงสถานะลิขสิทธิ์นี้ถูกเพิ่มเพื่อให้เป็นไปตามการเปลี่ยนแปลงสัญญาอนุญาตของมูลนิธิวิกิมีเดีย จาก GFDL ไปยัง GFDL ควบคู่กับ CC-BY-SA 3.0


Notes

  1. Data from Moberg et al. was taken directly from the supplemental information accompanying the Nature article.
  2. Data for Oerlemans was provided by William M. Connolley.
  3. Esper et al. reported only fluctuations in "arbitrary" units, so the variance in this record was rescaled to match the variance during the period of overlap with the instrumental record.
  4. When a paper included multiple reconstructions, the global annually average temperature data was used. If this was not reported, then Northern Hemisphere annually averaged data was used.
  5. Four records appearing at [2] were not used in preparing this graph for the following reasons:
    1. Mann et al. 98 was not included because Mann et al. 99 extended and updated that record.
    2. Briffa et al. 98 was not included because Briffa et al. 2001 extended and updated that record.
    3. Pollack et al. 98 was not included because the reported data was not found to be in a form that allowed for easy replotting.
    4. Mann et al. 2000 was not used because it did not include an original reconstruction covering at least the Northern Hemisphere.


Dragons flight's Temperature Record Series
This figure is part of a series of plots created by Dragons flight to illustrate
changes in Earth's temperature and climate across many different time scales.
Time Period: 25 yrs | 150 yrs | 1 kyr | 2 kyr | 12 kyr | 450 kyr | 5 Myr | 65 Myr | 500 Myr
For articles related to this topic see: Temperature record

คำบรรยายโดยย่อ

เพิ่มคำบรรยายทรรทัดเดียวเพื่อขยายความว่าไฟล์นี้มีอะไร

ไอเทมที่แสดงอยู่ในไฟล์นี้

ประกอบด้วย

MIME type อังกฤษ

image/png

checksum อังกฤษ

896104465de636e551cb77de82d0892e1e892551

data size อังกฤษ

32,749 ไบต์

442 พิกเซล

599 พิกเซล

ประวัติไฟล์

คลิกวันที่/เวลาเพื่อดูไฟล์ที่ปรากฏในขณะนั้น

วันที่/เวลารูปย่อขนาดผู้ใช้ความเห็น
ปัจจุบัน06:14, 22 พฤศจิกายน 2562รูปย่อสำหรับรุ่นเมื่อ 06:14, 22 พฤศจิกายน 2562599 × 442 (32 กิโลไบต์)MyridiumSomebody updated the image with a "2016" label that isn't even included in the data analysed! Data analysed only goes up to 2004.
13:54, 5 พฤษภาคม 2562รูปย่อสำหรับรุ่นเมื่อ 13:54, 5 พฤษภาคม 2562599 × 500 (48 กิโลไบต์)TobusUpdate to show 2016 temperature anomaly
00:10, 17 กรกฎาคม 2557รูปย่อสำหรับรุ่นเมื่อ 00:10, 17 กรกฎาคม 2557599 × 442 (32 กิโลไบต์)JeffyPShrinkin' the image.
05:51, 18 ธันวาคม 2548รูปย่อสำหรับรุ่นเมื่อ 05:51, 18 ธันวาคม 2548599 × 442 (40 กิโลไบต์)Saperaud~commonswiki*'''Description:''' [[en:Image:{{subst:PAGENAME}}]]

หน้าต่อไปนี้ โยงมาที่ภาพนี้:

การใช้ไฟล์ข้ามโครงการ

วิกิอื่นต่อไปนี้ใช้ไฟล์นี้: