
ไฟล์:Vostok-ice-core-petit.png

Vostok-ice-core-petit.png (598 × 441 พิกเซล, ขนาดไฟล์: 31 กิโลไบต์, ชนิดไมม์: image/png)
| รูปภาพหรือไฟล์เสียงนี้ ต้นฉบับอยู่ที่ คอมมอนส์ รายละเอียดด้านล่าง เป็นข้อความที่แสดงผลจาก ไฟล์ต้นฉบับในคอมมอนส์
|

|
ภาพนี้มีภาพในรูปแบบเวกเตอร์ (SVG)
หากภาพ SVG ทำให้การแสดงผลดีกว่า หน้าที่ใช้ภาพนี้ควรเปลี่ยนไปใช้ภาพ SVG แทน File:Vostok-ice-core-petit.png → File:Vostok Petit data.svg
สำหรับข้อมูลเพิ่มเติมเกี่ยวกับภาพเวกเตอร์ ดูที่ การเปลี่ยนไปใช้ภาพ SVG ในคอมมอนส์ นอกจากนี้สามารถดูเพิ่มเติมเกี่ยวกับ ข้อมูลเกี่ยวกับการรองรับภาพ SVG สำหรับซอฟต์แวร์มีเดียวิกิ ได้ |
 |
{{Transferred from|en.wikipedia|Maksim}manikanta}
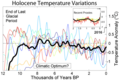
Graph of CO2 (Green graph), temperature (Blue graph), and dust concentration (Red graph) measured from the Vostok, Antarctica ice core as reported by Petit et al., 1999. Higher dust levels are believed to be caused by cold, dry periods.

|
อนุญาตให้คัดลอก แจกจ่ายและ/หรือดัดแปรเอกสารนี้ภายใต้เงื่อนไขของสัญญาอนุญาตเอกสารเสรีของกนู รุ่น 1.2 หรือรุ่นใด ๆ นับจากนี้ที่ออกโดยมูลนิธิซอฟต์แวร์เสรี โดยไม่มีส่วนใดห้ามแก้ไข ไม่มีข้อความปกหน้าและปกหลัง สำเนาของสัญญาอนุญาตรวมอยู่ในส่วนชื่อ สัญญาอนุญาตเอกสารเสรีของกนู |
| ไฟล์นี้อยู่ภายใต้สัญญาอนุญาต ครีเอทีฟคอมมอนส์ แบบแสดงที่มา-อนุญาตแบบเดียวกัน 3.0 ต้นฉบับ | ||
| ||
| ป้ายแสดงสถานะลิขสิทธิ์นี้ถูกเพิ่มเพื่อให้เป็นไปตามการเปลี่ยนแปลงสัญญาอนุญาตของมูลนิธิวิกิมีเดีย จาก GFDL ไปยัง GFDL ควบคู่กับ CC-BY-SA 3.0 |
Data from: http://www.ngdc.noaa.gov/paleo/icecore/antarctica/vostok/vostok_data.html
Error: journal= not stated.
Related Images
-
 Comparison of CO2 changes to recent changes
 -
 Additional ice age temperature data
 -
 Longer record of ice ages
 -
 Temperature changes since the end of the last ice age
 -
 Another presentation of Vostok Data
 -
 Comparison of Greenland and Antarctica ice cores


| date/time | username | edit summary |
|---|---|---|
| 12:37, 12 February 2006 | en:User:William M. Connolley | (rv. Its not "hard to see" its impossible to see. There is a point worth discusing here, though) |
| 12:03, 12 February 2006 | en:User:Terjepetersen | |
| 19:36, 5 February 2006 | en:User:Leland McInnes | (<span class="autocomment"><a href="/wiki/Image:Vostok-ice-core-petit.png#Related_Images" title="Image:Vostok-ice-core-petit.png">→</a>Related Images -</span> prettier comparison graph) |
| 19:19, 27 April 2005 | en:User:SEWilco | (Explain interest in dust levels) |
| 04:46, 27 April 2005 | en:User:Dragons flight | (related images.) |
| 04:32, 27 April 2005 | en:User:64.161.25.248 | (update text) |
| 04:00, 4 June 2004 | en:User:Template namespace initialisation script | |
| 08:47, 5 May 2004 | en:User:William M. Connolley | (Axes!) |
| 08:44, 5 May 2004 | en:User:William M. Connolley | (Add info) |
| 08:40, 5 May 2004 | en:User:William M. Connolley | (Graph of Vostok CO2/T/dust from Petit paper) |
บันทึกการอัพโหลด
Legend: (cur) = this is the current file, (del) = delete this old version, (rev) = revert to this old version.
Click on date to download the file or see the image uploaded on that date.
- (del) (cur) 04:24, 27 April 2005 . . en:User:Dragons_flight Dragons flight ( en:User_talk:Dragons_flight Talk) . . 598x441 (31557 bytes) (Prettier Version of Data)
- (del) (rev) 08:40, 5 May 2004 . . en:User:William_M._Connolley William M. Connolley ( en:User_talk:William_M._Connolley Talk) . . 586x207 (7154 bytes) (Graph of Vostok CO2/T/dust from Petit paper)
derivative works
ไฟล์อื่นที่ใช้ไฟล์นี้: Vostok Petit data.svg
ประวัติไฟล์
คลิกวันที่/เวลาเพื่อดูไฟล์ที่ปรากฏในขณะนั้น
| วันที่/เวลา | รูปย่อ | ขนาด | ผู้ใช้ | ความเห็น | |
|---|---|---|---|---|---|
| ปัจจุบัน | 03:38, 16 กุมภาพันธ์ 2549 | | 598 × 441 (31 กิโลไบต์) | Maksim | La bildo estas kopiita de wikipedia:en. La originala priskribo estas: Graph of CO<sub>2</sub>, temperature, and dust concentration measured from the Vostok, Antarctica ice core as reported by Petit et al., 1999. Higher dus |
หน้าที่มีภาพนี้
หน้าต่อไปนี้ โยงมาที่ภาพนี้:
การใช้ไฟล์ข้ามโครงการ
วิกิอื่นต่อไปนี้ใช้ไฟล์นี้:
- การใช้บน af.wikipedia.org
- การใช้บน ar.wikipedia.org
- การใช้บน bn.wikipedia.org
- การใช้บน bs.wikipedia.org
- การใช้บน ca.wikipedia.org
- การใช้บน da.wikipedia.org
- การใช้บน en.wikipedia.org
- การใช้บน eo.wikipedia.org
- การใช้บน gl.wikipedia.org
- การใช้บน gu.wikipedia.org
- การใช้บน he.wikipedia.org
- การใช้บน hr.wikipedia.org
- การใช้บน hu.wikipedia.org
- การใช้บน ja.wikipedia.org
- การใช้บน kn.wikipedia.org
- การใช้บน ko.wikipedia.org
- การใช้บน nn.wikipedia.org
- การใช้บน sh.wikipedia.org
- การใช้บน sl.wikipedia.org
- การใช้บน sq.wikipedia.org
- การใช้บน ta.wikipedia.org
- การใช้บน test.wikipedia.org
- การใช้บน vi.wikipedia.org
ดูการใช้ข้ามโครงการเพิ่มเติมของไฟล์นี้