
ไฟล์:World energy consumption.svg

ขนาดของตัวอย่าง PNG นี้ของไฟล์ SVG นี้: 750 × 560 พิกเซล ความละเอียดอื่น: 320 × 239 พิกเซล | 640 × 478 พิกเซล | 1,024 × 765 พิกเซล | 1,280 × 956 พิกเซล | 2,560 × 1,911 พิกเซล
ดูภาพที่มีความละเอียดสูงกว่า ((ไฟล์ SVG, 750 × 560 พิกเซล, ขนาดไฟล์: 19 กิโลไบต์))
| รูปภาพหรือไฟล์เสียงนี้ ต้นฉบับอยู่ที่ คอมมอนส์ รายละเอียดด้านล่าง เป็นข้อความที่แสดงผลจาก ไฟล์ต้นฉบับในคอมมอนส์
|
ความย่อ
| คำอธิบาย |
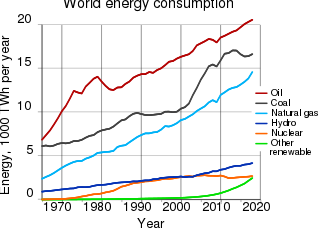
English: World energy consumption. Deutsch: Weltenergiebedarf. |
| วันที่ | |
| แหล่งที่มา | BP Statistical Review of World Energy 2017 |
| ผู้สร้างสรรค์ | Con-struct |
| เวอร์ชันอื่น |
[]
|
| SVG genesis | ซอร์สโค้ดของ SVG นี้ตรวจสอบถูกต้องแล้ว ไฟล์ภาพกราฟิกส์เวกเตอร์นี้ สร้างขึ้นโดยใช้ Inkscape, or with something else. This file uses embedded text that can be easily translated using a text editor. |
| Note | English: This svg file contains the original graph data. Deutsch: Die svg-Datei enthält die dargestellten Daten als Original-Werte. |
| Template for indication of the source | <ref name="BP-Review-2014">BP: [http://www.bp.com/statisticalreview Statistical Review of World Energy], Workbook (xlsx), London, 2014</ref> |


Generated with Wikimedia SVG Chart
| Data format | The source data of the chart is in the SVG image file in a clearly readable format. You see the original numbers inside of the SVG file in the form of a list such as this:
... 1995 10.06 1996 11.75 1997 12.45 ... |
| Content of SVG | To view the data download the SVG file itself. To do so right-click this link, and then choose the option to save: File:World energy consumption.svg. Launch any text editor. Open the downloaded SVG file with the text editor (usually; file menu, open). To see the list of data, search for the phrase id="graph1". |
| Please, do not use a special SVG editor such as Inkscape; the readability of the database would be destroyed. You can edit the SVG file with any text editor, for example; en: List of text editors. You can view the edited SVG file in various web browsers. As of 2011, all major desktop browsers, and many minor ones, have some level of SVG support. See: en: Scalable Vector Graphics#Support for SVG in web browsers. When satisfied with your edits, upload the edited SVG file with the link labeled "Upload a new version of this file".
W3C-validity not checked. This chart was created with Wikimedia SVG Chart. This chart uses embedded text/digits. |
|
| Code to generate SVG | See: File talk:World energy consumption.svg. Documentation see: Wikimedia SVG Chart. |
Conversions

| - Power in Watt | |
| - Power in toe (tonne of oil equivalent) | |
| - Conversion factor of tonne of oil equivalent to watt, 11.63 megawatt hours / toe | |
| - Energy conversion efficiency, 38%, see BP statistical_review_of_world_energy_2013.pdf |


Example
| , statistical_review_of_world_energy_2013_workbook.xlsx, tab "Oil Production – tonnes", cell "AW89" | |
| , see Terawatt |


The conversion factor is exactly 4.4194 TWh/Mtoe, according to the ...workbook.xlsx, tab "Approximate conversion factors".
การอนุญาตใช้สิทธิ
ข้าพเจ้า ในฐานะผู้ถือลิขสิทธิ์ของภาพหรือสื่อนี้ อนุญาตให้ใช้ภาพหรือสื่อนี้ภายใต้เงื่อนไขต่อไปนี้

|
อนุญาตให้คัดลอก แจกจ่ายและ/หรือดัดแปรเอกสารนี้ภายใต้เงื่อนไขของสัญญาอนุญาตเอกสารเสรีของกนู รุ่น 1.2 หรือรุ่นใด ๆ นับจากนี้ที่ออกโดยมูลนิธิซอฟต์แวร์เสรี โดยไม่มีส่วนใดห้ามแก้ไข ไม่มีข้อความปกหน้าและปกหลัง สำเนาของสัญญาอนุญาตรวมอยู่ในส่วนชื่อ สัญญาอนุญาตเอกสารเสรีของกนู |
ไฟล์นี้อยู่ภายใต้สัญญาอนุญาตครีเอทีฟคอมมอนส์ รุ่นแสดงที่มา-อนุญาตแบบเดียวกัน 3.0 ต้นฉบับ, 2.5 ทั่วไป, 2.0 ทั่วไป และ 1.0 ทั่วไป
- คุณสามารถ:
- ที่จะแบ่งปัน – ที่จะทำสำเนา แจกจ่าย และส่งงานดังกล่าวต่อไป
- ที่จะเรียบเรียงใหม่ – ที่จะดัดแปลงงานดังกล่าว
- ภายใต้เงื่อนไขต่อไปนี้:
- แสดงที่มา – คุณต้องให้เกียรติเจ้าของงานอย่างเหมาะสม โดยเพิ่มลิงก์ไปยังสัญญาอนุญาต และระบุหากมีการเปลี่ยนแปลง คุณอาจทำเช่นนี้ได้ในรูปแบบใดก็ได้ตามควร แต่ต้องไม่ใช่ในลักษณะที่แนะว่าผู้ให้อนุญาตสนับสนุนคุณหรือการใช้งานของคุณ
- อนุญาตแบบเดียวกัน – หากคุณดัดแปลง เปลี่ยนรูป หรือต่อเติมงานนี้ คุณต้องใช้สัญญาอนุญาตแบบเดียวกันหรือแบบที่เหมือนกับสัญญาอนุญาตที่ใช้กับงานนี้เท่านั้น
คุณสามารถเลือกสัญญาอนุญาตดังกล่าวตามต้องการ
ประวัติไฟล์
คลิกวันที่/เวลาเพื่อดูไฟล์ที่ปรากฏในขณะนั้น
| วันที่/เวลา | รูปย่อ | ขนาด | ผู้ใช้ | ความเห็น | |
|---|---|---|---|---|---|
| ปัจจุบัน | 06:38, 14 มกราคม 2565 | | 750 × 560 (19 กิโลไบต์) | TAKAHASHI Shuuji | File uploaded using svgtranslate tool (https://svgtranslate.toolforge.org/). Added translation for ja. |
| 04:54, 26 กรกฎาคม 2562 |  | 750 × 560 (18 กิโลไบต์) | Wiklol | update; source: http://web.archive.org/web/20190616172232/https://www.bp.com/content/dam/bp/business-sites/en/global/corporate/xlsx/energy-economics/statistical-review/bp-stats-review-2019-all-data.xlsx | |
| 05:43, 5 ธันวาคม 2560 |  | 750 × 560 (106 กิโลไบต์) | Delphi234 | update | |
| 16:59, 11 มิถุนายน 2559 |  | 750 × 520 (104 กิโลไบต์) | Delphi234 | update | |
| 12:29, 13 กันยายน 2558 |  | 750 × 520 (132 กิโลไบต์) | Delphi234 | remove transparency | |
| 12:22, 13 กันยายน 2558 |  | 750 × 520 (132 กิโลไบต์) | Delphi234 | remove transparency | |
| 12:16, 13 กันยายน 2558 |  | 750 × 520 (131 กิโลไบต์) | Delphi234 | convert text to path | |
| 11:23, 13 กันยายน 2558 |  | 750 × 520 (16 กิโลไบต์) | Delphi234 | update | |
| 11:26, 20 มิถุนายน 2557 |  | 750 × 520 (17 กิโลไบต์) | Delphi234 | fix typo | |
| 11:23, 20 มิถุนายน 2557 |  | 750 × 520 (17 กิโลไบต์) | Delphi234 | fix typo |
หน้าที่มีภาพนี้
หน้าต่อไปนี้ โยงมาที่ภาพนี้:
การใช้ไฟล์ข้ามโครงการ
วิกิอื่นต่อไปนี้ใช้ไฟล์นี้:
- การใช้บน ar.wikipedia.org
- การใช้บน cs.wikipedia.org
- การใช้บน en.wikipedia.org
- การใช้บน es.wikipedia.org
- การใช้บน fa.wikipedia.org
- การใช้บน fr.wikipedia.org
- การใช้บน ha.wikipedia.org
- การใช้บน hu.wikipedia.org
- การใช้บน io.wikipedia.org
- การใช้บน ml.wikipedia.org
- การใช้บน pt.wikipedia.org
- การใช้บน sl.wikipedia.org
- การใช้บน sv.wikipedia.org
- การใช้บน uk.wikipedia.org
- การใช้บน vi.wikipedia.org
- Chất dẻo
- Ấm lên toàn cầu
- Sản xuất chế tạo
- Anthropocene
- Đánh giá tác động môi trường
- Phá hủy sinh cảnh
- Bản mẫu:Tác động của con người với môi trường
- Thành viên:GregKaye
- Trồng rừng
- Population Matters
- Nông nghiệp hữu cơ
- Mỏ đá
- Vấn đề môi trường
- Tác động môi trường của dược phẩm và các sản phẩm chăm sóc cá nhân
- Tái trồng rừng
- Chu trình photpho
- Suy thoái đất
- Tác động môi trường của giấy
- Tác động của con người đến môi trường
- Mất đa dạng sinh học
- Tác động của công nghiệp năng lượng lên môi trường
- Tác động của sơn đến môi trường
- Thành viên:Dangkhoanew/nháp
ดูการใช้ข้ามโครงการเพิ่มเติมของไฟล์นี้