
ไฟล์:Subprime crisis - Foreclosures & Bank Instability.png

ดูภาพที่มีความละเอียดสูงกว่า (960 × 720 พิกเซล, ขนาดไฟล์: 16 กิโลไบต์, ชนิดไมม์: image/png)
| รูปภาพหรือไฟล์เสียงนี้ ต้นฉบับอยู่ที่ คอมมอนส์ รายละเอียดด้านล่าง เป็นข้อความที่แสดงผลจาก ไฟล์ต้นฉบับในคอมมอนส์
|

|
ภาพแผนภาพนี้ ควรจะถูกสร้างใหม่เป็นกราฟิกส์เวกเตอร์ ซึ่งมีข้อดีอีกหลายประการ ดูเพิ่มเติมที่คอมมอนส์:สื่อต้องการเก็บกวาดสำหรับสารสนเทศเพิ่มเติม หากภาพนี้มีในรูปแบบกราฟิกส์เวกเตอร์อยู่แล้ว กรุณาอัปโหลดและแทนที่แม่แบบนี้ด้วย
{{vector version available|ชื่อภาพใหม่}}
แนะนำเป็นอย่างยิ่งให้ตั้งชื่อไฟล์เวกเตอร์ใหม่นั้นในรูปแบบ "Subprime crisis - Foreclosures & Bank Instability.svg" แล้วใส่แม่แบบ Vector version available (หรือ Vva) ซึ่งไม่ต้องใช้พารามิเตอร์ ชื่อภาพใหม่ |
| คำอธิบาย |
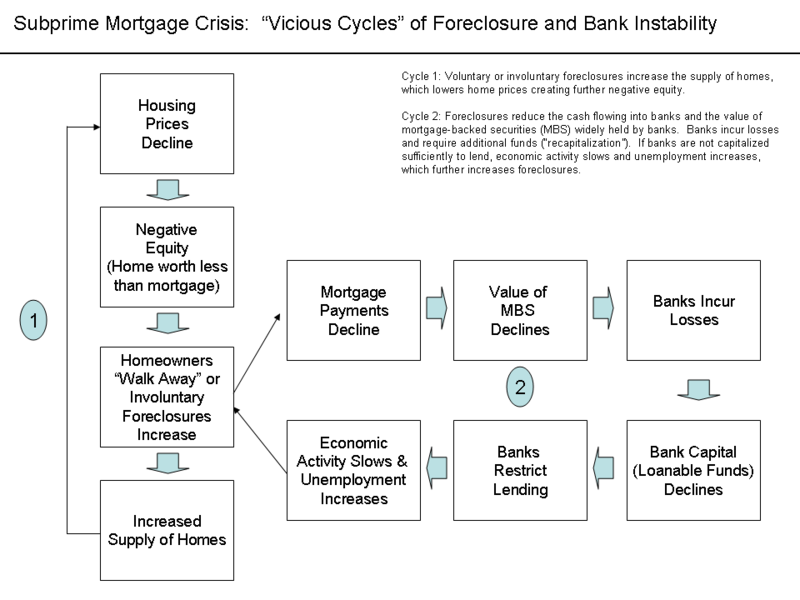
English: Chart showing feedback loops within housing market and with financial market and economy ความย่อThis diagram explains two vicious cycles at the heart of the subprime mortgage crisis. Cycle One: Housing MarketThe first cycle is within the housing market. Voluntary or involuntary foreclosures increase the supply of homes, which lowers home prices creating further negative equity. By September 2008, average U.S. housing prices had declined by over 20% from their mid-2006 peak.[1][2] This major and unexpected decline in house prices means that many borrowers have zero or negative equity in their homes, meaning their homes were worth less than their mortgages. As of March 2008, an estimated 8.8 million borrowers — 10.8% of all homeowners — had negative equity in their homes, a number that is believed to have risen to 12 million by November 2008. Borrowers in this situation have an incentive to "walk away" from their mortgages and abandon their homes, even though doing so will damage their credit rating for a number of years. The reason is that unlike what is the case in most other countries, American residential mortgages are non-recourse loans; once the creditor has regained the property purchased with a mortgage in default, he has no further claim against the defaulting borrower's income or assets. As more borrowers stop paying their mortgage payments, foreclosures and the supply of homes for sale increase. This places downward pressure on housing prices, which further lowers homeowners' equity. The decline in mortgage payments also reduces the value of mortgage-backed securities, which erodes the net worth and financial health of banks. This vicious cycle is at the heart of the crisis.[3] Cycle Two: Financial Market and Feedback into Housing MarketForeclosures reduce the cash flowing into banks and the value of mortgage-backed securities (MBS) widely held by banks. Banks incur losses and require additional funds (“recapitalization”). If banks are not capitalized sufficiently to lend, economic activity slows and unemployment increases, which further increases foreclosures. As of August 2008, financial firms around the globe have written down their holdings of subprime related securities by US$501 billion. Mortgage defaults and provisions for future defaults caused profits at the 8533 USA depository institutions insured by the FDIC to decline from $35.2 billion in 2006 Q4 billion to $646 million in the same quarter a year later, a decline of 98%. 2007 Q4 saw the worst bank and thrift quarterly performance since 1990. In all of 2007, insured depository institutions earned approximately $100 billion, down 31% from a record profit of $145 billion in 2006. Profits declined from $35.6 billion in 2007 Q1 to $19.3 billion in 2008 Q1, a decline of 46%. Federal Reserve data indicates banks have significantly tightened lending standards throughout the crisis.[4] Unemployment in the U.S. has increased to a 14-year high as of November 2008.[5] Further Sources and SolutionsEconomist Nouriel Roubini described the vicious cycles within and across the housing market and financial markets during interviews with Charlie Rose in September and October 2008.[6] He further describes the crisis in these other video segments.[7][8] He called for an additional $250 billion to help recapitalize the banks, closure of insolvent "zombie" banks, regulatory overhaul, and $300 billion in infrastructure spending during these interviews. ReferencesSee alsoThe images below contain additional high-level explanation of the crisis further citations. thumb|Factors Contributing to Housing Bubble – Diagram 1 of 2 thumb|Domino Effect As Housing Prices Declined – Diagram 2 of 2 |
| วันที่ | |
| แหล่งที่มา | งานของตัว (Original text: I created this work entirely by myself.) |
| ผู้สร้างสรรค์ | Farcaster (talk) 17:06, 26 December 2008 (UTC) |
- ↑ Case Shiller Index
- ↑ Economist-A Helping Hand to Homeowners
- ↑ NYT - How to Help People Who's Homes are Underwater
- ↑ Banks Tighten Lending Standards
- ↑ https://www.nytimes.com/2008/11/08/business/economy/08econ.html?pagewanted=print NY Times - Unemployment]
- ↑ Charlie Rose - Roubini & Panel
- ↑ Rose & Roubini Discussion
- ↑ Rose & Roubini
การอนุญาตใช้สิทธิ
- คุณสามารถ:
- ที่จะแบ่งปัน – ที่จะทำสำเนา แจกจ่าย และส่งงานดังกล่าวต่อไป
- ที่จะเรียบเรียงใหม่ – ที่จะดัดแปลงงานดังกล่าว
- ภายใต้เงื่อนไขต่อไปนี้:
- แสดงที่มา – คุณต้องให้เกียรติเจ้าของงานอย่างเหมาะสม โดยเพิ่มลิงก์ไปยังสัญญาอนุญาต และระบุหากมีการเปลี่ยนแปลง คุณอาจทำเช่นนี้ได้ในรูปแบบใดก็ได้ตามควร แต่ต้องไม่ใช่ในลักษณะที่แนะว่าผู้ให้อนุญาตสนับสนุนคุณหรือการใช้งานของคุณ
- อนุญาตแบบเดียวกัน – หากคุณดัดแปลง เปลี่ยนรูป หรือต่อเติมงานนี้ คุณต้องใช้สัญญาอนุญาตแบบเดียวกันหรือแบบที่เหมือนกับสัญญาอนุญาตที่ใช้กับงานนี้เท่านั้น

|
อนุญาตให้คัดลอก แจกจ่ายและ/หรือดัดแปรเอกสารนี้ภายใต้เงื่อนไขของสัญญาอนุญาตเอกสารเสรีของกนู รุ่น 1.2 หรือรุ่นใด ๆ นับจากนี้ที่ออกโดยมูลนิธิซอฟต์แวร์เสรี โดยไม่มีส่วนใดห้ามแก้ไข ไม่มีข้อความปกหน้าและปกหลัง สำเนาของสัญญาอนุญาตรวมอยู่ในส่วนชื่อ สัญญาอนุญาตเอกสารเสรีของกนู |
บันทึกการอัพโหลด
- 2008-12-26 17:34 Farcaster 960×720× (16380 bytes)
- 2008-12-26 17:29 Farcaster 960×720× (16314 bytes)
- 2008-12-26 17:06 Farcaster 960×720× (16314 bytes) {{Information |Description=Chart showing feedback loops within housing market and with financial market and economy |Source=I created this work entirely by myself. |Date= |Author=~~~~ |other_versions= }}
ประวัติไฟล์
คลิกวันที่/เวลาเพื่อดูไฟล์ที่ปรากฏในขณะนั้น
| วันที่/เวลา | รูปย่อ | ขนาด | ผู้ใช้ | ความเห็น | |
|---|---|---|---|---|---|
| ปัจจุบัน | 07:51, 14 ตุลาคม 2553 | | 960 × 720 (16 กิโลไบต์) | Hideokun | {{Information |Description={{en|Chart showing feedback loops within housing market and with financial market and economy<br/> ==Description== This diagram explains two vicious cycles at the heart of the [[:en:subprime mortgage crisis |
หน้าที่มีภาพนี้
ไม่มีหน้าใดโยงมาที่ภาพนี้
การใช้ไฟล์ข้ามโครงการ
วิกิอื่นต่อไปนี้ใช้ไฟล์นี้:
- การใช้บน en.wikipedia.org
- การใช้บน fa.wikipedia.org
- การใช้บน hi.wikipedia.org
- การใช้บน ja.wikipedia.org
- การใช้บน pt.wikipedia.org
- การใช้บน ta.wikipedia.org