
ไฟล์:Milankovitch Variations sv.png
Milankovitch_Variations_sv.png (479 × 363 พิกเซล, ขนาดไฟล์: 25 กิโลไบต์, ชนิดไมม์: image/png)
| รูปภาพหรือไฟล์เสียงนี้ ต้นฉบับอยู่ที่ คอมมอนส์ รายละเอียดด้านล่าง เป็นข้อความที่แสดงผลจาก ไฟล์ต้นฉบับในคอมมอนส์
|

|
ภาพนี้มีภาพในรูปแบบเวกเตอร์ (SVG)
หากภาพ SVG ทำให้การแสดงผลดีกว่า หน้าที่ใช้ภาพนี้ควรเปลี่ยนไปใช้ภาพ SVG แทน File:Milankovitch Variations sv.png → File:Milankovitch Variations-es.svg
สำหรับข้อมูลเพิ่มเติมเกี่ยวกับภาพเวกเตอร์ ดูที่ การเปลี่ยนไปใช้ภาพ SVG ในคอมมอนส์ นอกจากนี้สามารถดูเพิ่มเติมเกี่ยวกับ ข้อมูลเกี่ยวกับการรองรับภาพ SVG สำหรับซอฟต์แวร์มีเดียวิกิ ได้ |
 |
This is a Swedish translation of Milankovitch Variations.png [1].
![[1]](https://en.wikipedia.org/wiki/Image:Milankovitch_Variations.png)
Description at the english version:
ความย่อ
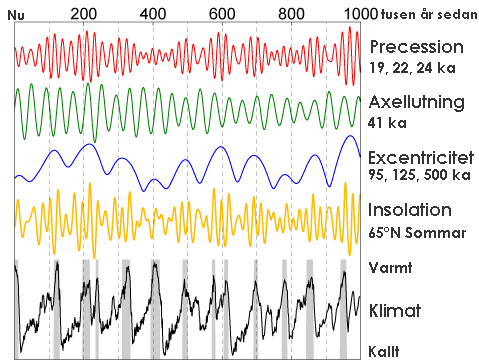
This figure shows the variations in Earth's orbit, the resulting changes in solar energy flux at high latitude, and the observed glacial cycles.
According to Milankovitch Theory, the precession of the equinoxes, variations in the tilt of the Earth's axis (obliquity) and changes in the eccentricity of the Earth's orbit are responsible for causing the observed 100 kyr cycle in ice ages by varying the amount of sunlight received by the Earth at different times and locations, particularly high northern latitude summer. These changes in the Earth's orbit are the predictable consequence of interactions between the Earth, its moon, and the other planets.
The orbital data shown is from Quinn et al. (1991). Principal frequencies for each of the three kinds of variations are labeled. The solar forcing curve (aka "insolation") is derived from July 1st sunlight at 65 °N latitude according to Jonathan Levine's insolation calculator [2]. The glacial data is from Lisiecki and Raymo (2005) and gray bars indicate interglacial periods, defined here as deviations in the 5 kyr average of at least 0.8 standard deviations above the mean.
Copyright
This image was produced by Robert A. Rohde from publicly available data, and is incorporated into the Global Warming Art project.

|
อนุญาตให้คัดลอก แจกจ่ายและ/หรือดัดแปรเอกสารนี้ภายใต้เงื่อนไขของสัญญาอนุญาตเอกสารเสรีของกนู รุ่น 1.2 หรือรุ่นใด ๆ นับจากนี้ที่ออกโดยมูลนิธิซอฟต์แวร์เสรี โดยไม่มีส่วนใดห้ามแก้ไข ไม่มีข้อความปกหน้าและปกหลัง สำเนาของสัญญาอนุญาตรวมอยู่ในส่วนชื่อ สัญญาอนุญาตเอกสารเสรีของกนู |
| ไฟล์นี้อยู่ภายใต้สัญญาอนุญาต ครีเอทีฟคอมมอนส์ แบบแสดงที่มา-อนุญาตแบบเดียวกัน 3.0 ต้นฉบับ | ||
| ||
| ป้ายแสดงสถานะลิขสิทธิ์นี้ถูกเพิ่มเพื่อให้เป็นไปตามการเปลี่ยนแปลงสัญญาอนุญาตของมูลนิธิวิกิมีเดีย จาก GFDL ไปยัง GFDL ควบคู่กับ CC-BY-SA 3.0 |
References
- Lisiecki, L. E., and M. E. Raymo (2005), A Pliocene-Pleistocene stack of 57 globally distributed benthic d18O records, Paleoceanography 20, PA1003, doi:10.1029/2004PA001071.[3]
- Quinn, T.R. et al. "A Three Million Year Integration of the Earth's Orbit." The Astronomical Journal 101 pp. 2287-2305 (June 1991).
ประวัติไฟล์
คลิกวันที่/เวลาเพื่อดูไฟล์ที่ปรากฏในขณะนั้น
| วันที่/เวลา | รูปย่อ | ขนาด | ผู้ใช้ | ความเห็น | |
|---|---|---|---|---|---|
| ปัจจุบัน | 00:29, 15 ธันวาคม 2549 | | 479 × 363 (25 กิโลไบต์) | Shinzon | This is a Swedish translation of Milankovitch Variations.png [http://en.wikipedia.org/wiki/Image:Milankovitch_Variations.png]. Discription at the english version: == Description == This figure shows the variations in Earth's orbit, the resulting chan |
หน้าที่มีภาพนี้
หน้าต่อไปนี้ โยงมาที่ภาพนี้:
การใช้ไฟล์ข้ามโครงการ
วิกิอื่นต่อไปนี้ใช้ไฟล์นี้:
- การใช้บน ar.wikipedia.org
- การใช้บน as.wikipedia.org
- การใช้บน bh.wikipedia.org
- การใช้บน bn.wikipedia.org
- การใช้บน cy.wikipedia.org
- การใช้บน diq.wikipedia.org
- การใช้บน en.wikipedia.org
- การใช้บน en.wikiversity.org
- การใช้บน fa.wikipedia.org
- การใช้บน hi.wikipedia.org
- การใช้บน hr.wikipedia.org
- การใช้บน kbd.wikipedia.org
- การใช้บน kk.wikipedia.org
- การใช้บน kn.wikipedia.org
- การใช้บน ko.wikipedia.org
- การใช้บน la.wikipedia.org
- การใช้บน lo.wikipedia.org
- การใช้บน lt.wikipedia.org
- การใช้บน mai.wikipedia.org
- การใช้บน mnw.wikipedia.org
- การใช้บน new.wikipedia.org
- การใช้บน nn.wikipedia.org
- การใช้บน no.wikipedia.org
- การใช้บน pa.wikipedia.org
- การใช้บน sh.wikipedia.org
- การใช้บน simple.wikipedia.org
- การใช้บน sr.wikipedia.org
- การใช้บน sv.wikipedia.org
- การใช้บน tcy.wikipedia.org
- การใช้บน ug.wikipedia.org
- การใช้บน uk.wikipedia.org
- การใช้บน vi.wikipedia.org