
ไฟล์:Public Debt and Debt to GDP- 2010.png

ดูภาพที่มีความละเอียดสูงกว่า (960 × 720 พิกเซล, ขนาดไฟล์: 27 กิโลไบต์, ชนิดไมม์: image/png)
| รูปภาพหรือไฟล์เสียงนี้ ต้นฉบับอยู่ที่ คอมมอนส์ รายละเอียดด้านล่าง เป็นข้อความที่แสดงผลจาก ไฟล์ต้นฉบับในคอมมอนส์
|
ความย่อ
| คำอธิบาย |
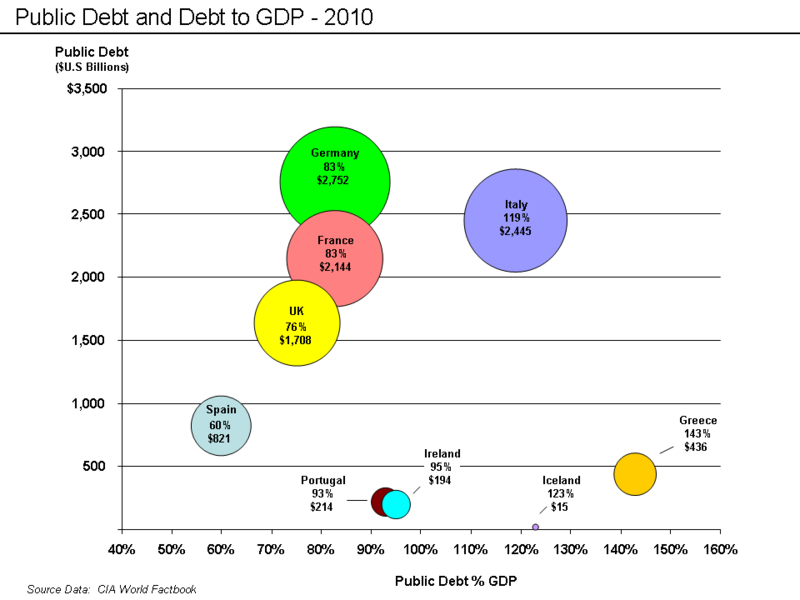
English: Public debt and debt to GDP 2010 |
| วันที่ | (UTC) (Uploaded on Commons at 2012-02-23 20:03:04 (UTC)/Originally uploaded at 2011-12-05 05:36:25) |
| แหล่งที่มา | I (Farcaster (talk)) created this work entirely by myself using CIA Factbook data (Originally uploaded on en.wikipedia) |
| ผู้สร้างสรรค์ | Farcaster (talk) 20:19, 4 December 2011 (UTC) (Transferred by ain92/Originally uploaded by Farcaster) |
Chart description
For selected countries, this bubble chart shows public debt measured in $US and public debt as a % of GDP. The bubble size represents the public debt $ amount. The public debt is computed from the CIA World Factbook's GDP figure (at official exchange rates) multiplied by the public debt as % GDP amount. The percentage is a direct citation from the Factbook. GDP is 2010 and debt is as of June 2011.
The ability of a nation to pay its public debt is a function of the government's financial position (i.e. revenue growth rates, the budget deficit and debt to GDP ratio) as well as economic growth and interest rates on the debt. Credit rating agencies assign a credit rating to the debt that reflects their assessment of numerous risk factors.
Note this chart covers 'public debt only, which represents the obligations of each country's federal government. External debt is the sum of public and private debt owed to foreigners. Some of these countries have external debts far larger than their public debt. The ability of the nation's industries to pay the private portion of the external debt relates to their competitiveness, the nation's economic growth, and employment levels, among many other factors.
Source data
Source data is the CIA World Factbook. Here is the citation for Italy: CIA World Factbook-Italy archive copy at the Wayback Machine
การอนุญาตใช้สิทธิ
- คุณสามารถ:
- ที่จะแบ่งปัน – ที่จะทำสำเนา แจกจ่าย และส่งงานดังกล่าวต่อไป
- ที่จะเรียบเรียงใหม่ – ที่จะดัดแปลงงานดังกล่าว
- ภายใต้เงื่อนไขต่อไปนี้:
- แสดงที่มา – คุณต้องให้เกียรติเจ้าของงานอย่างเหมาะสม โดยเพิ่มลิงก์ไปยังสัญญาอนุญาต และระบุหากมีการเปลี่ยนแปลง คุณอาจทำเช่นนี้ได้ในรูปแบบใดก็ได้ตามควร แต่ต้องไม่ใช่ในลักษณะที่แนะว่าผู้ให้อนุญาตสนับสนุนคุณหรือการใช้งานของคุณ
- อนุญาตแบบเดียวกัน – หากคุณดัดแปลง เปลี่ยนรูป หรือต่อเติมงานนี้ คุณต้องใช้สัญญาอนุญาตแบบเดียวกันหรือแบบที่เหมือนกับสัญญาอนุญาตที่ใช้กับงานนี้เท่านั้น

|
อนุญาตให้คัดลอก แจกจ่ายและ/หรือดัดแปรเอกสารนี้ภายใต้เงื่อนไขของสัญญาอนุญาตเอกสารเสรีของกนู รุ่น 1.2 หรือรุ่นใด ๆ นับจากนี้ที่ออกโดยมูลนิธิซอฟต์แวร์เสรี โดยไม่มีส่วนใดห้ามแก้ไข ไม่มีข้อความปกหน้าและปกหลัง สำเนาของสัญญาอนุญาตรวมอยู่ในส่วนชื่อ สัญญาอนุญาตเอกสารเสรีของกนู |
บันทึกการอัพโหลด
Upload date | User | Bytes | Dimensions | Comment
- 2011-12-05 05:36:25 | Farcaster | 27716 | 960×720 |
- 2011-12-04 23:15:32 | Farcaster | 27324 | 960×720 |
- 2011-12-04 20:19:40 | Farcaster | 27283 | 960×720 | {{Information |Description = Public debt and debt to GDP 2010 |Source = I (~~~) created this work entirely by myself using CIA Factbook data |Date = ~~~~~ |Author = ~~~~ |other_versions = }}
ประวัติไฟล์
คลิกวันที่/เวลาเพื่อดูไฟล์ที่ปรากฏในขณะนั้น
| วันที่/เวลา | รูปย่อ | ขนาด | ผู้ใช้ | ความเห็น | |
|---|---|---|---|---|---|
| ปัจจุบัน | 03:04, 24 กุมภาพันธ์ 2555 | | 960 × 720 (27 กิโลไบต์) | Ain92 | {{BotMoveToCommons|en.wikipedia|year={{subst:CURRENTYEAR}}|month={{subst:CURRENTMONTHNAME}}|day={{subst:CURRENTDAY}}}} The tool and the bot are operated by User:Jan Luca and User:Magnus Manske. {{Information |Description = {{en|Public debt and... |
หน้าที่มีภาพนี้
หน้าต่อไปนี้ โยงมาที่ภาพนี้:
การใช้ไฟล์ข้ามโครงการ
วิกิอื่นต่อไปนี้ใช้ไฟล์นี้:
- การใช้บน ast.wikipedia.org
- การใช้บน en.wikipedia.org
- การใช้บน es.wikipedia.org
- การใช้บน it.wikipedia.org