
ไฟล์:Jellyfish population trends by LME.jpg

ขนาดของตัวอย่างนี้: 800 × 399 พิกเซล ความละเอียดอื่น: 320 × 160 พิกเซล | 640 × 319 พิกเซล | 1,022 × 510 พิกเซล
ดูภาพที่มีความละเอียดสูงกว่า (1,022 × 510 พิกเซล, ขนาดไฟล์: 310 กิโลไบต์, ชนิดไมม์: image/jpeg)
| รูปภาพหรือไฟล์เสียงนี้ ต้นฉบับอยู่ที่ คอมมอนส์ รายละเอียดด้านล่าง เป็นข้อความที่แสดงผลจาก ไฟล์ต้นฉบับในคอมมอนส์
|
ความย่อ
| คำอธิบาย |
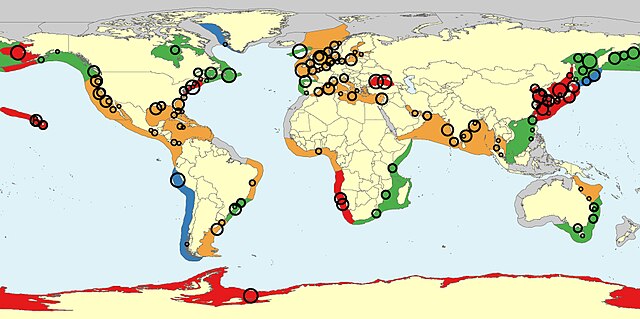
English: Map of population trends of native and invasive species of jellyfish by LME (Large Marine Ecosystem). Red increase (high certainty), orange increase (low certainty), green stable/variable, blue decrease, grey no data. Circles represent discrete chronicles with relative sizes reflecting the Confidence Index. Circle locations are approximate, as some were shifted to avoid overlap; the circle for the Antarctic LME summarizes circumpolar observations. |
| วันที่ | |
| แหล่งที่มา | Brotz, Lucas; Cheung, William W. L.; Kleisner Kristin; Pakhomov, Evgeny; Pauly, Daniel (2012). "Increasing jellyfish populations: trends in Large Marine Ecosystems". Hydrobiologia 688. DOI:10.1007/s10750-012-1039-7., http://www.publicaffairs.ubc.ca/2012/04/18/jellyfish-on-the-rise-ubc-study/ |
| ผู้สร้างสรรค์ | Lucas Brotz, William W. L. Cheung, Kristin Kleisner, Evgeny Pakhomov & Daniel Pauly |

|
ภาพแผนที่ชีวภูมิศาสตร์นี้ ควรจะถูกสร้างใหม่เป็นกราฟิกส์เวกเตอร์ ซึ่งมีข้อดีอีกหลายประการ ดูเพิ่มเติมที่คอมมอนส์:สื่อต้องการเก็บกวาดสำหรับสารสนเทศเพิ่มเติม หากภาพนี้มีในรูปแบบกราฟิกส์เวกเตอร์อยู่แล้ว กรุณาอัปโหลดและแทนที่แม่แบบนี้ด้วย
{{vector version available|ชื่อภาพใหม่}}
แนะนำเป็นอย่างยิ่งให้ตั้งชื่อไฟล์เวกเตอร์ใหม่นั้นในรูปแบบ "Jellyfish population trends by LME.svg" แล้วใส่แม่แบบ Vector version available (หรือ Vva) ซึ่งไม่ต้องใช้พารามิเตอร์ ชื่อภาพใหม่ |


การอนุญาตใช้สิทธิ
ไฟล์นี้อยู่ภายใต้สัญญาอนุญาตครีเอทีฟคอมมอนส์ รุ่น แสดงที่มา 2.0 ทั่วไป
- คุณสามารถ:
- ที่จะแบ่งปัน – ที่จะทำสำเนา แจกจ่าย และส่งงานดังกล่าวต่อไป
- ที่จะเรียบเรียงใหม่ – ที่จะดัดแปลงงานดังกล่าว
- ภายใต้เงื่อนไขต่อไปนี้:
- แสดงที่มา – คุณต้องให้เกียรติเจ้าของงานอย่างเหมาะสม โดยเพิ่มลิงก์ไปยังสัญญาอนุญาต และระบุหากมีการเปลี่ยนแปลง คุณอาจทำเช่นนี้ได้ในรูปแบบใดก็ได้ตามควร แต่ต้องไม่ใช่ในลักษณะที่แนะว่าผู้ให้อนุญาตสนับสนุนคุณหรือการใช้งานของคุณ
This file, which was originally posted to
https://doi.org/10.1007/s10750-012-1039-7, was reviewed on 5 February 2020 by reviewer AntiCompositeNumber, who confirmed that it was available there under the stated license on that date.
|
ประวัติไฟล์
คลิกวันที่/เวลาเพื่อดูไฟล์ที่ปรากฏในขณะนั้น
| วันที่/เวลา | รูปย่อ | ขนาด | ผู้ใช้ | ความเห็น | |
|---|---|---|---|---|---|
| ปัจจุบัน | 13:17, 21 เมษายน 2555 | | 1,022 × 510 (310 กิโลไบต์) | InverseHypercube |
หน้าที่มีภาพนี้
หน้าต่อไปนี้ โยงมาที่ภาพนี้:
การใช้ไฟล์ข้ามโครงการ
วิกิอื่นต่อไปนี้ใช้ไฟล์นี้:
- การใช้บน bg.wikipedia.org
- การใช้บน da.wikipedia.org
- การใช้บน de.wikipedia.org
- การใช้บน en.wikipedia.org
- การใช้บน fa.wikipedia.org
- การใช้บน it.wikipedia.org
- การใช้บน ja.wikipedia.org
- การใช้บน tr.wikipedia.org
- การใช้บน uk.wikipedia.org
- การใช้บน zh.wikipedia.org