
ไฟล์:2014 militrary expenditures absolute.svg

ขนาดของตัวอย่าง PNG นี้ของไฟล์ SVG นี้: 512 × 288 พิกเซล ความละเอียดอื่น: 320 × 180 พิกเซล | 640 × 360 พิกเซล | 1,024 × 576 พิกเซล | 1,280 × 720 พิกเซล | 2,560 × 1,440 พิกเซล
ดูภาพที่มีความละเอียดสูงกว่า ((ไฟล์ SVG, 512 × 288 พิกเซล, ขนาดไฟล์: 1.52 เมกะไบต์))
| รูปภาพหรือไฟล์เสียงนี้ ต้นฉบับอยู่ที่ คอมมอนส์ รายละเอียดด้านล่าง เป็นข้อความที่แสดงผลจาก ไฟล์ต้นฉบับในคอมมอนส์
|
ความย่อ
| คำอธิบาย |
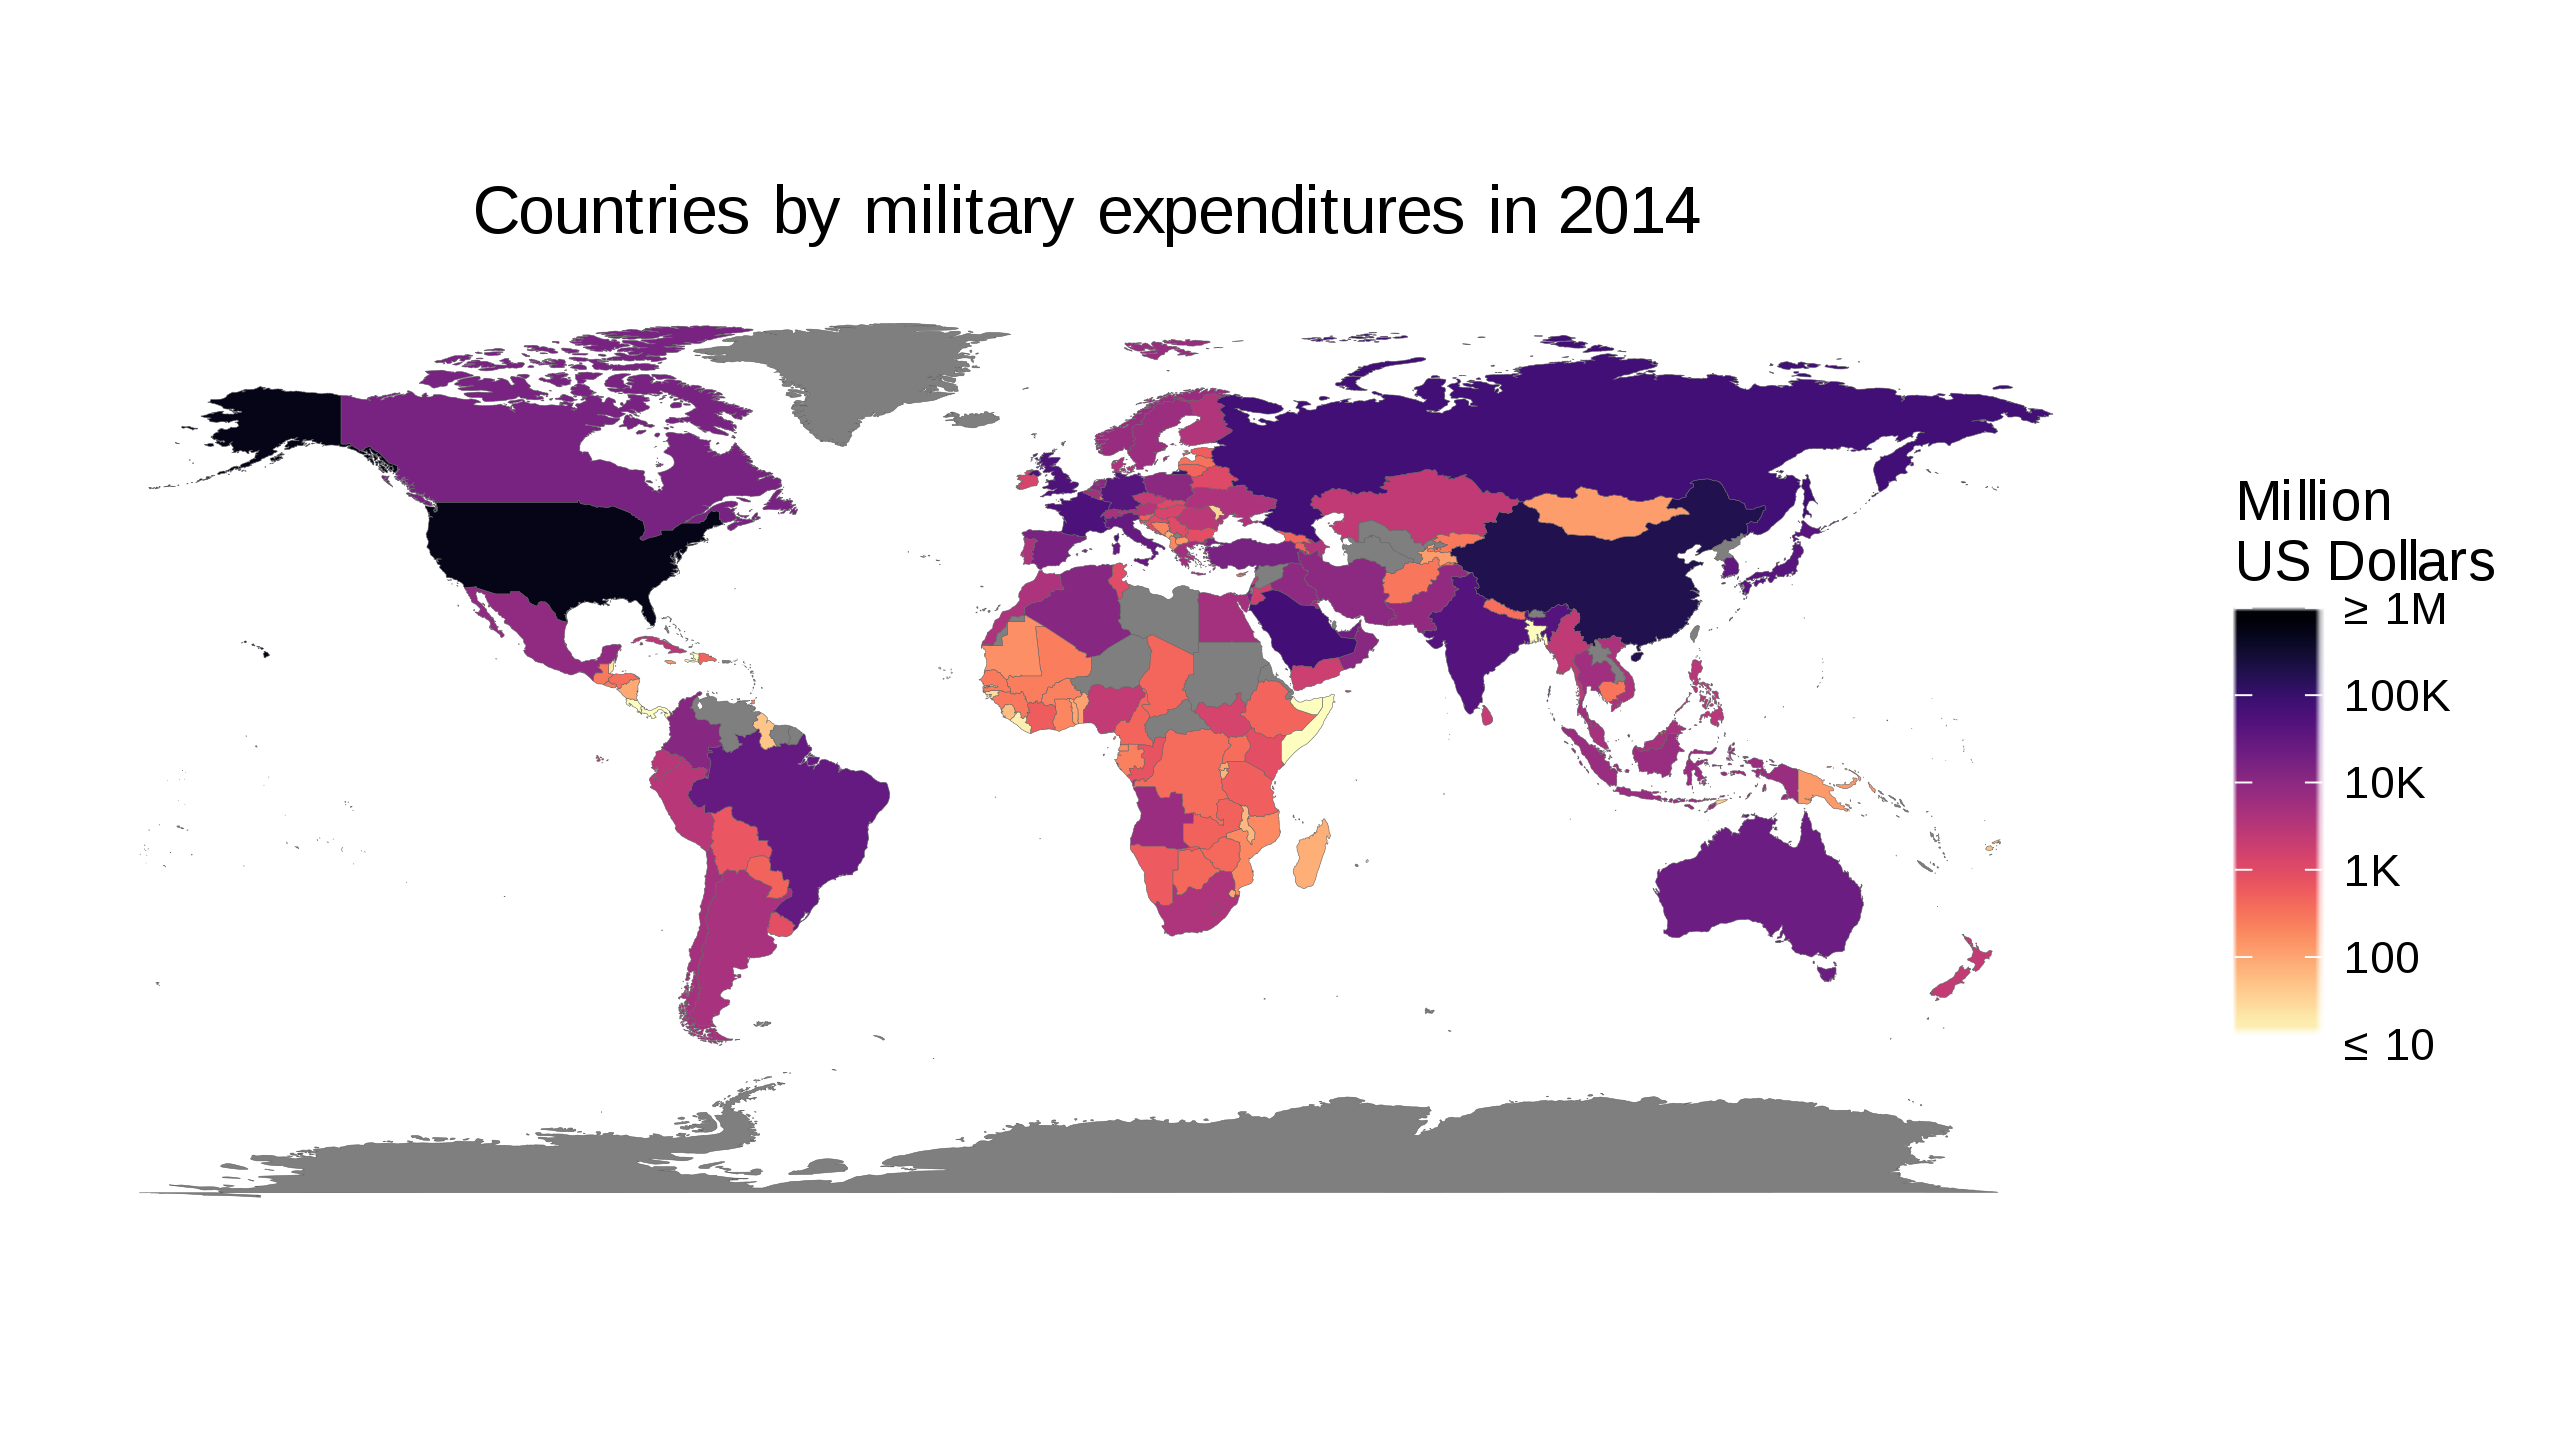
English: Based on the Worldbank data from http://data.worldbank.org/indicator/MS.MIL.XPND.GD.ZS and http://data.worldbank.org/indicator/NY.GDP.MKTP.CD This is a candidate for replacing/augmenting https://commons.wikimedia.org/wiki/File:Countries_by_Military_expenditures_(%25_of_GDP)_in_2014_v2.svg |
| แหล่งที่มา | งานของตัว |
| ผู้สร้างสรรค์ | Pipping |
_in_2014_v2.svg)
การอนุญาตใช้สิทธิ
ข้าพเจ้า ในฐานะผู้ถือลิขสิทธิ์ของภาพหรือสื่อนี้ อนุญาตให้ใช้ภาพหรือสื่อนี้ภายใต้เงื่อนไขต่อไปนี้
ไฟล์นี้อยู่ภายใต้สัญญาอนุญาต ครีเอทีฟคอมมอนส์ แบบแสดงที่มา-อนุญาตแบบเดียวกัน 4.0 นานาชาติ
- คุณสามารถ:
- ที่จะแบ่งปัน – ที่จะทำสำเนา แจกจ่าย และส่งงานดังกล่าวต่อไป
- ที่จะเรียบเรียงใหม่ – ที่จะดัดแปลงงานดังกล่าว
- ภายใต้เงื่อนไขต่อไปนี้:
- แสดงที่มา – คุณต้องให้เกียรติเจ้าของงานอย่างเหมาะสม โดยเพิ่มลิงก์ไปยังสัญญาอนุญาต และระบุหากมีการเปลี่ยนแปลง คุณอาจทำเช่นนี้ได้ในรูปแบบใดก็ได้ตามควร แต่ต้องไม่ใช่ในลักษณะที่แนะว่าผู้ให้อนุญาตสนับสนุนคุณหรือการใช้งานของคุณ
- อนุญาตแบบเดียวกัน – หากคุณดัดแปลง เปลี่ยนรูป หรือต่อเติมงานนี้ คุณต้องใช้สัญญาอนุญาตแบบเดียวกันหรือแบบที่เหมือนกับสัญญาอนุญาตที่ใช้กับงานนี้เท่านั้น
Created with the following piece of code:
library(magrittr)

selectedYear <- 2014

getWorldBankData <- function(indicatorCode, indicatorName) {
    baseName <- paste('API', indicatorCode, 'DS2_en_csv_v2', sep='_')
    ## Download zipfile if necessary
    zipfile <- paste(baseName, 'zip', sep='.')
    if (!file.exists(zipfile)) {
        zipurl <- paste(paste('http://api.worldbank.org/v2/en/indicator',
                              indicatorCode, sep='/'),
                        'downloadformat=csv', sep='?')
        download.file(zipurl, zipfile)
    }
    csvfile <- paste(baseName, 'csv', sep='.')
    ## This produces a warning because of the trailing commas. Safe to ignore.
    readr::read_csv(unz(zipfile, csvfile), skip=4,
                    col_types = list(`Indicator Name` = readr::col_character(),
                                     `Indicator Code` = readr::col_character(),
                                     `Country Name` = readr::col_character(),
                                     `Country Code` = readr::col_character(),
                                     .default = readr::col_double())) %>%
        dplyr::select(-c(`Indicator Name`, `Indicator Code`, `Country Name`))
}

## Obtain and merge World Bank data
worldBankData <-
    dplyr::left_join(
               getWorldBankData('MS.MIL.XPND.GD.ZS') %>%
               tidyr::gather(-`Country Code`, convert=TRUE,
                             key='Year', value=`Military expenditure (% of GDP)`,
                             na.rm = TRUE),
               getWorldBankData('NY.GDP.MKTP.CD') %>%
               tidyr::gather(-`Country Code`, convert=TRUE,
                             key='Year', value=`GDP (current US$)`,
                             na.rm = TRUE)) %>%
    dplyr::mutate(`Military expenditure (current $US)` =
                      `Military expenditure (% of GDP)`*`GDP (current US$)`/100) %>%
    dplyr::filter(Year == selectedYear) %>%
    dplyr::mutate(Year = NULL)

## Plotting: Obtain Geographic data
mapData <- tibble::as.tibble(ggplot2::map_data("world")) %>%
    dplyr::mutate(`Country Code` =
                      countrycode::countrycode(region, "country.name", "iso3c"),
                  ## This produces a warning but I do not see how we could do better
                  ## since we started with fuzzy names.
                  region = NULL, subregion = NULL)

combinedData <- dplyr::left_join(mapData, worldBankData)

## The default out-of-bounds function `censor` replaces values outside
## the range with NA. Since we have properly labelled the legend, we can
## project them onto the boundary instead
clamp <- function(x, range = c(0, 1)) {
    lower <- range[1]
    upper <- range[2]
    ifelse(x > lower, ifelse(x < upper, x, upper), lower)
}

ggplot2::ggplot(data = combinedData, ggplot2::aes(long,lat)) +
    ggplot2::geom_polygon(ggplot2::aes(group = group,
                                       fill  = `Military expenditure (current $US)`),
                          color = '#606060', lwd=0.05) +
    ggplot2::scale_fill_gradientn(colours= rev(viridis::magma(256, alpha = 0.5)),
                                  name   = "Million\nUS Dollars",
                                  trans  = "log",
                                  oob    = clamp,
                                  breaks = c(1e7,1e8,1e9,1e10,1e11,1e12),
                                  labels = c('\u2264 10', '100', '1K',
                                             '10K', '100K', '\u2265 1M'),
                                  limits = c(1e7,1e12)) +
    ggplot2::coord_fixed() +
    ggplot2::theme_bw() +
    ggplot2::theme(plot.title = ggplot2::element_text(hjust = 0.5),
          axis.title = ggplot2::element_blank(),
          axis.text = ggplot2::element_blank(),
          axis.ticks = ggplot2::element_blank(),
          panel.grid.major = ggplot2::element_blank(),
          panel.grid.minor = ggplot2::element_blank(),
          panel.border = ggplot2::element_blank(),
          panel.background = ggplot2::element_blank()) +
    ggplot2::labs(title = paste("Countries by military expenditures in",
                                selectedYear))

ggplot2::ggsave(paste(selectedYear, 'militrary_expenditures_absolute.svg', sep='_'),
                height=100, units='mm')
ประวัติไฟล์
คลิกวันที่/เวลาเพื่อดูไฟล์ที่ปรากฏในขณะนั้น
| วันที่/เวลา | รูปย่อ | ขนาด | ผู้ใช้ | ความเห็น | |
|---|---|---|---|---|---|
| ปัจจุบัน | 21:30, 20 พฤษภาคม 2560 | | 512 × 288 (1.52 เมกะไบต์) | Pipping | redo with dplyr |
| 19:12, 13 พฤษภาคม 2560 |  | 512 × 256 (1.51 เมกะไบต์) | Pipping | Handle truncation of the data range better: We distinguish between 0 and no data, but any existing datum below 10M USD is coloured the same way and all data above 1T USD are coloured the same way. The legend makes this clear. | |
| 15:55, 13 พฤษภาคม 2560 |  | 512 × 256 (1.51 เมกะไบต์) | Pipping | Completely redone. The former was in local currency (so that comparisons from country to country made absolutely no sense). Now everything is in current US dollars. | |
| 05:32, 12 พฤษภาคม 2560 |  | 512 × 256 (1.5 เมกะไบต์) | Pipping | Fixed min/max value for colors that kept anything below 1,000,000,000 US dollars from having a colour (now: Anything above 1,000,000 US dollars has a colour). | |
| 04:30, 12 พฤษภาคม 2560 |  | 512 × 256 (1.51 เมกะไบต์) | Pipping | {{Information |Description ={{en|1=English: Based on the Worldbank data from http://data.worldbank.org/indicator/MS.MIL.XPND.CN This is a candidate for replacing/augmenting https://commons.wikimedia.org/wiki/File:Countries_by_Military_expenditures_(... |
หน้าที่มีภาพนี้
หน้าต่อไปนี้ โยงมาที่ภาพนี้:
การใช้ไฟล์ข้ามโครงการ
วิกิอื่นต่อไปนี้ใช้ไฟล์นี้:
- การใช้บน bg.wikipedia.org
- การใช้บน ca.wikipedia.org
- การใช้บน en.wikipedia.org
- การใช้บน eu.wikipedia.org
- การใช้บน sr.wikipedia.org
- การใช้บน uk.wikipedia.org