
ไฟล์:Foreclosure trend - 2007.svg

ดูภาพที่มีความละเอียดสูงกว่า ((ไฟล์ SVG, 395 × 407 พิกเซล, ขนาดไฟล์: 15 กิโลไบต์))
| รูปภาพหรือไฟล์เสียงนี้ ต้นฉบับอยู่ที่ คอมมอนส์ รายละเอียดด้านล่าง เป็นข้อความที่แสดงผลจาก ไฟล์ต้นฉบับในคอมมอนส์
|
ความย่อ
| คำอธิบาย |
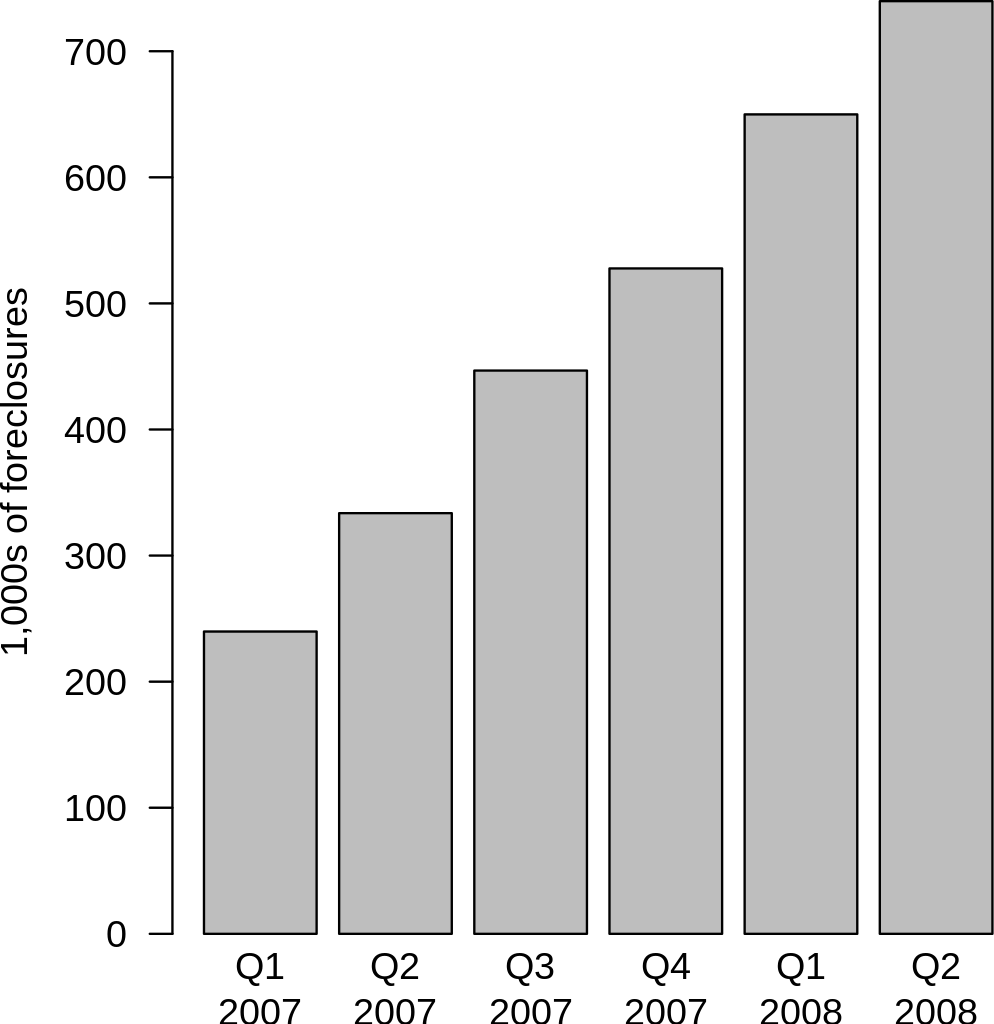
English: This data was publicly disclosed by RealtyTrac through press releases available on their website, some of which are cited in the 2007 Subprime Mortgage Financial Crisis article directly. I created the table from this data. I have calculated the Q1 and Q2 2007 data as follows:
Note that this adds to 1,547,863, not the 1,285,873 RealtyTrac cited for full year. The following is an explanation from RealtyTrac: "The reason for the numbers not adding up is that we run the reports for the year-end separately; we don’t just add up all the quarters. Because of the way the report is designed, it only counts each property once during the entire year even if the property has multiple filings against it during the timeframe used for the report. So when we run it for the entire year, the number will be lower than adding up all the quarters because there will be some properties that appeared in multiple quarters because they had foreclosure activity against them in more than one quarter." RealtyTrac includes default notices, auction sale notices and bank repossessions in its reporting and can include multiple filings on the same property. The number of total notices was 2.2 million for 2007, as cited in the year-end press release. |
| แหล่งที่มา | งานของตัว |
| ผู้สร้างสรรค์ | Emok |
| เวอร์ชันอื่น | Image:Foreclosure_Trend_-_2007.png |
R source code:
date<-c("Q1\n2007","Q2\n2007","Q3\n2007","Q4\n2007","Q1\n2008","Q2\n2008")
foreclosures<-c(239770,333627,446726,527740,649917,739714)
pdf('foreclosures.pdf', width=5, height=6)
barplot(foreclosures/1000, ylab="1,000s of foreclosures", las=1, names.arg=date)
dev.off()
การอนุญาตใช้สิทธิ
- คุณสามารถ:
- ที่จะแบ่งปัน – ที่จะทำสำเนา แจกจ่าย และส่งงานดังกล่าวต่อไป
- ที่จะเรียบเรียงใหม่ – ที่จะดัดแปลงงานดังกล่าว
- ภายใต้เงื่อนไขต่อไปนี้:
- แสดงที่มา – คุณต้องให้เกียรติเจ้าของงานอย่างเหมาะสม โดยเพิ่มลิงก์ไปยังสัญญาอนุญาต และระบุหากมีการเปลี่ยนแปลง คุณอาจทำเช่นนี้ได้ในรูปแบบใดก็ได้ตามควร แต่ต้องไม่ใช่ในลักษณะที่แนะว่าผู้ให้อนุญาตสนับสนุนคุณหรือการใช้งานของคุณ
- อนุญาตแบบเดียวกัน – หากคุณดัดแปลง เปลี่ยนรูป หรือต่อเติมงานนี้ คุณต้องใช้สัญญาอนุญาตแบบเดียวกันหรือแบบที่เหมือนกับสัญญาอนุญาตที่ใช้กับงานนี้เท่านั้น

|
อนุญาตให้คัดลอก แจกจ่ายและ/หรือดัดแปรเอกสารนี้ภายใต้เงื่อนไขของสัญญาอนุญาตเอกสารเสรีของกนู รุ่น 1.2 หรือรุ่นใด ๆ นับจากนี้ที่ออกโดยมูลนิธิซอฟต์แวร์เสรี โดยไม่มีส่วนใดห้ามแก้ไข ไม่มีข้อความปกหน้าและปกหลัง สำเนาของสัญญาอนุญาตรวมอยู่ในส่วนชื่อ สัญญาอนุญาตเอกสารเสรีของกนู |
ประวัติไฟล์
คลิกวันที่/เวลาเพื่อดูไฟล์ที่ปรากฏในขณะนั้น
| วันที่/เวลา | รูปย่อ | ขนาด | ผู้ใช้ | ความเห็น | |
|---|---|---|---|---|---|
| ปัจจุบัน | 01:10, 25 กันยายน 2551 | | 395 × 407 (15 กิโลไบต์) | Emok | {{Information |Description={{en|1=This data was publicly disclosed by RealtyTrac through press releases available on their website, some of which are cited in the 2007 Subprime Mortgage Financial Crisis article directly. I created the table from this dat |
หน้าที่มีภาพนี้
หน้าต่อไปนี้ โยงมาที่ภาพนี้:
การใช้ไฟล์ข้ามโครงการ
วิกิอื่นต่อไปนี้ใช้ไฟล์นี้:
- การใช้บน en.wikipedia.org
- การใช้บน vi.wikipedia.org